
Fraud rules basics or How to design a rule?
Build and refine an ATM-withdrawal fraud rule using time, amount and transaction location, balancing detection and false positives through a worked sample.
 By Ivan Skula
May 22, 2023
By Ivan Skula
May 22, 2023
Your company has successfully deployed an enterprise fraud solution with preventive capabilities, and you - as the most experienced fraud analyst - were asked to tackle the recent fraud related to cash withdrawals through ATMs. This might not be a trivial task because if the rule isn't fine-tuned, it could block genuine customers' cash withdrawals, leading to unnecessary complaints (a.k.a. customer friction).
Data Exploration Toolset
To identify the pattern of fraudulent behavior linked to cash withdrawal fraud cases, you need to perform an analysis on top of the actual data to check and confirm or reject your ideas. Open an exploratory analysis tool of your choice (in the worst case, an Excel sheet :) ) so you can "play" with the data.
You have identified the table with card transactions (in the worst-case scenario, you have it in Excel). First, apply a filter to select only transactions originating from ATMs; next, apply another filter to select only cash withdrawal transactions, since our new rule will focus exclusively on these transactions.
The analysis
Now that we have the data ready, we start with our analysis. As experienced fraud analysts, we know that the most straightforward and, many times, also most efficient rules focus on anomalies - characteristics that stand out from "normal" behavior. What "normal" means is flexible and always tied to the pattern or behavior we try to observe or spot. So for the first pattern, we will want to check the hour of the day when the transaction occurred.
Our sample dataset has 12 records with 6 frauds and 6 genuine transactions:

- FF=Fraud Flag, FF=1 means record is fraudulent, FF=0 means record is genuine,
- HOUR_OF_DAY is the hour from <0-24> when the transaction occurred (time is in local timezone)
Let's use our exploratory analysis tool and visualize the data in the HOUR_OF_DAY column:

Looking at the distribution of transactions across the 24h window, we can see that fraudulent transactions mostly occurred late at night or early in the morning. So, for the initial version of the rule, we can try to use the condition HOUR_OF_DAY < 5:
RULE 1a: if (HOUR_OF_DAY <=5) then ALERT()

Looking at this rule's efficacy, it hits 5 out of 6 frauds (TP=5) but also generates 2 false positives (FP=2). And since we are more focused on low FP, we will adjust the rule.
RULE 1b: if (HOUR_OF_DAY > 1 and HOUR_OF_DAY <=5) then ALERT()

This adjusted rule has TP=4 (so we miss 2 out of 6 frauds), but FP=1.
We improved the initial condition and decreased FP, but we also decreased TP; now, let's see whether we can use other interesting characteristics in our rule.
One of the most common, if not the most common, fields/columns used in almost any rule is TNX_AMT (transaction amount). It is often used to filter out very low-amount transactions, which - even if fraudulent - wouldn't make sense to investigate, as the investigation cost might be higher than the lost amount. So let us expand our dataset with this new column.

Let us visualize the transactions using both characteristics - HOUR_OF_DAY as well as TNX_AMT:

When we look at the transaction layout and focus on the x-axis representing the amount, we observe that most transactions fall beyond 450 (LCY = local currency). So, we adjust the rule accordingly.
RULE 2a: if (HOUR_OF_DAY <=5 and TNX_AMT >= 450) then ALERT()

This new rule hits 5 out of 6 frauds (TP=5), but it also generates 1 false positive (FP=1). And since we are more focused on low FP, we will adjust the b) version of the rule.
RULE 2b: if ((HOUR_OF_DAY > 1 and HOUR_OF_DAY <=5) and TNX_AMT >= 450) then ALERT()

This version of the rule hits 4 out of 6 frauds (TP=4), but it doesn't generate false positives (FP=0), and that is very good news.
Repeating our previous process, we look for another relevant indicator that might improve the KPIs of the rule we have designed so far.
Another characteristic would be whether the transaction was performed locally or outside the country (domestic vs. international transactions). This might make a lot of sense, especially with the first characteristic - HOUR_OF_DAY. International transactions can happen locally at any hour of the day because of different time zones. So if we were observing a lot of fraudulent ATM transactions at night or in the early morning, that might not be the case for international transactions happening on the other side of the globe.
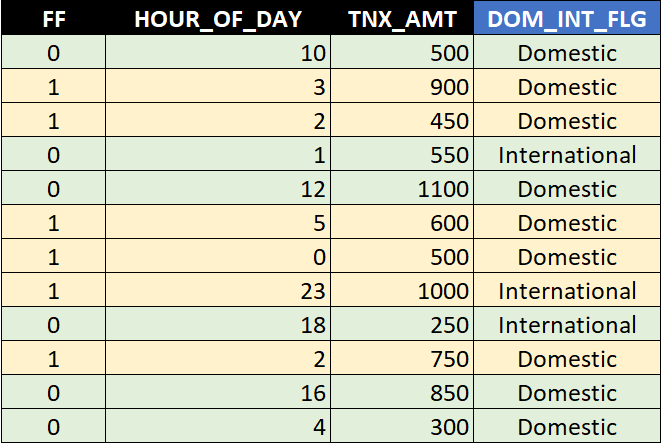
Visualizing the 3rd metric would require 3 dimensions, but we will cheat by using icons depicting whether the transaction is domestic (house icon) or international (plane icon).

Looking at the visualization, we can adjust our rule as follows:
RULE 3: if ((HOUR_OF_DAY <=5 and TNX_AMT >= 450 and DOM_INT_FLG = "Domestic") then ALERT()

Now this rule is an adjustment of version 2a) of our rule, but as we can see, it gives better KPI metrics. This rule can capture 5 out of 6 frauds (TP=5) while not triggering false positives (FP=0).
Conclusion
This way, we could continue testing further patterns and try to capture the last remaining fraud (from our sample dataset), or create a separate rule targeting only international ATM withdrawals. Nevertheless, for our example, we conclude the current task and consider the rule ready for deployment to production.
But as you are probably well aware, it will not be as straightforward as in the example above. You will potentially work with thousands or millions of transactions, among which you will have a few tens or hundreds of frauds. So the best approach to tackle the wide variety of fraud cases is to divide and conquer. That means selecting fraud types with common behavior patterns and mitigating them one by one, ordered by priority (number of incidents, loss amount, etc.).
The next best approach is to leverage analytics, which can help you build more accurate models (rules), though sometimes with less explainable structure. But this is a topic for another blog.


